By Evan Sangaline | May 23, 2017
Hacker News Title Tool
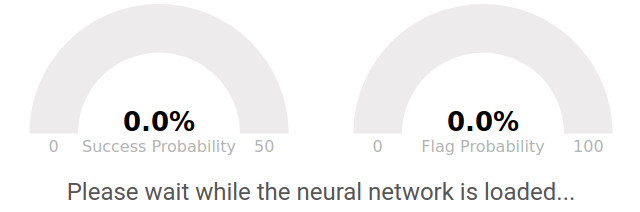
Enter a potential title for a Hacker News submission below to see how likely it is to succeed or to be flagged dead.
Once you play around a bit you can read on to learn how exactly these predictions are made.
Background
Submitting an article to Hacker News can be a little stressful if you’ve invested a lot of time in writing it. An article’s success really hinges upon getting the initial four or five votes that will push it on to the front page where it can reach a broader audience. There’s a fair bit of luck that goes into that but obviously things like the time of day when it’s submitted, the wording of the title, and the article itself also play a significant role (though I can say from experience that these first upvotes often come before someone could have possibly actually read the article). Whatever the factors, it’s in any content creator’s best interest to submit their stories in a way that will maximize their potential for success.
I’ve occasionally seen commenters on Hacker News discuss the ideal time to post submissions and 5AM PST on weekdays has seemed to be the general consensus. This seems reasonable in terms of catching east coast developers before they start their work day and then being able to ride the front page throughout the day but I was curious to see if the data actually backed this up or if it was just an old developer’s tale. I decided to take a look at all of the historical Hacker News submissions to see if this advice was sound.
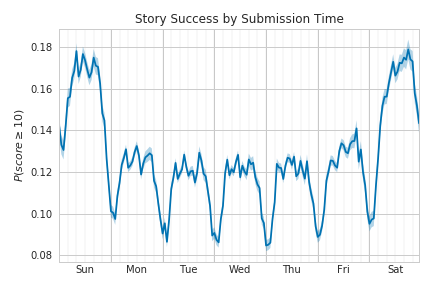
I was primarily interested in reaching the front page so I defined a score threshold of 10 as a heuristic for “success.” This is somewhat arbitrary but I think it’s a reasonable approximation of making it to the front page. Looking at the fraction of the stories that hit this success threshold revealed that stories submitted on the weekends are nearly 50% more likely to make it to the front page.
This alone doesn’t necessarily refute the conventional wisdom; it’s still totally possible that stories on the front page during the weekend get so much less traffic that the increased likelihood of getting there doesn’t make up for it. This can be tested somewhat by looking at the average scores of submissions which are likely to be much more closely related to traffic.
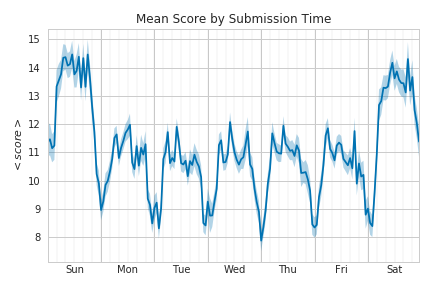
This looks quite similar to the success probability over time and it strongly suggests that the weekend is the better time to submit a story regardless of whether your goal is to maximize traffic or your chances of getting on the front page. That actually came as quite a surprise to me. It is of course possible that the ratio of views to votes changes on the weekend but it’s hard to say for sure.
While we’re looking at these, it’s also fun to zoom in and look at the patterns over a 24 hour period.
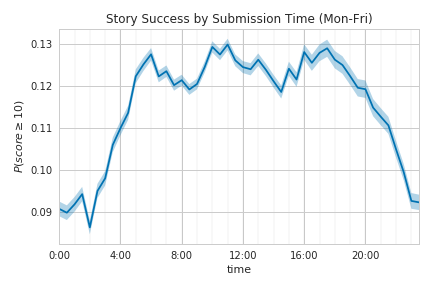
There are somewhat well-defined peaks at around 6:00AM, 10:30AM, and 5:00PM PST. Any theories as to what exactly is causing these? Is it some mixture of before/after work and lunch time in different time zones?
Going Beyond Submission Time
After making myself question my habit of submitting articles on weekday mornings, I got curious about how big of an effect buzzwords have on a story’s success. Do people blindly upvote anything that had TensorFlow in the title? Well.. here’s hoping at least!
To answer this, I started out with a Bag of Words/Naive Bayes approach. That worked well enough but it couldn’t account for some other factors that I was curious about (e.g. capitalization schemes, punctuation). And so I shook off a vague feeling that I should be doing actual work and sought out to train a more advanced classifier.
Let me tell you, that first classifier was incredible. It had three glorious character-level convolution layers followed by forwards and backwards LSTMs. It worked great and picked up all sorts of long range structure.
Unfortunately, when I went to import this incredible model into JavaScript with KerasJS, I quickly learned that it doesn’t support Keras 2 and then more slowly learned that it doesn’t support LSTMs (the documentation might tell you otherwise, but the documentation is lying). KerasJS, I love you but you’re bringing me down. So I hastily threw together another network with a simpler structure that can run in-browser with a fairly modest download size (~2 MB).
This second network is what powers the title predictor at the top of this article. Alas, it is not the greatest network I trained… it is just a tribute.
The Network
The architecture of the second iteration of the model looks a little something like this.
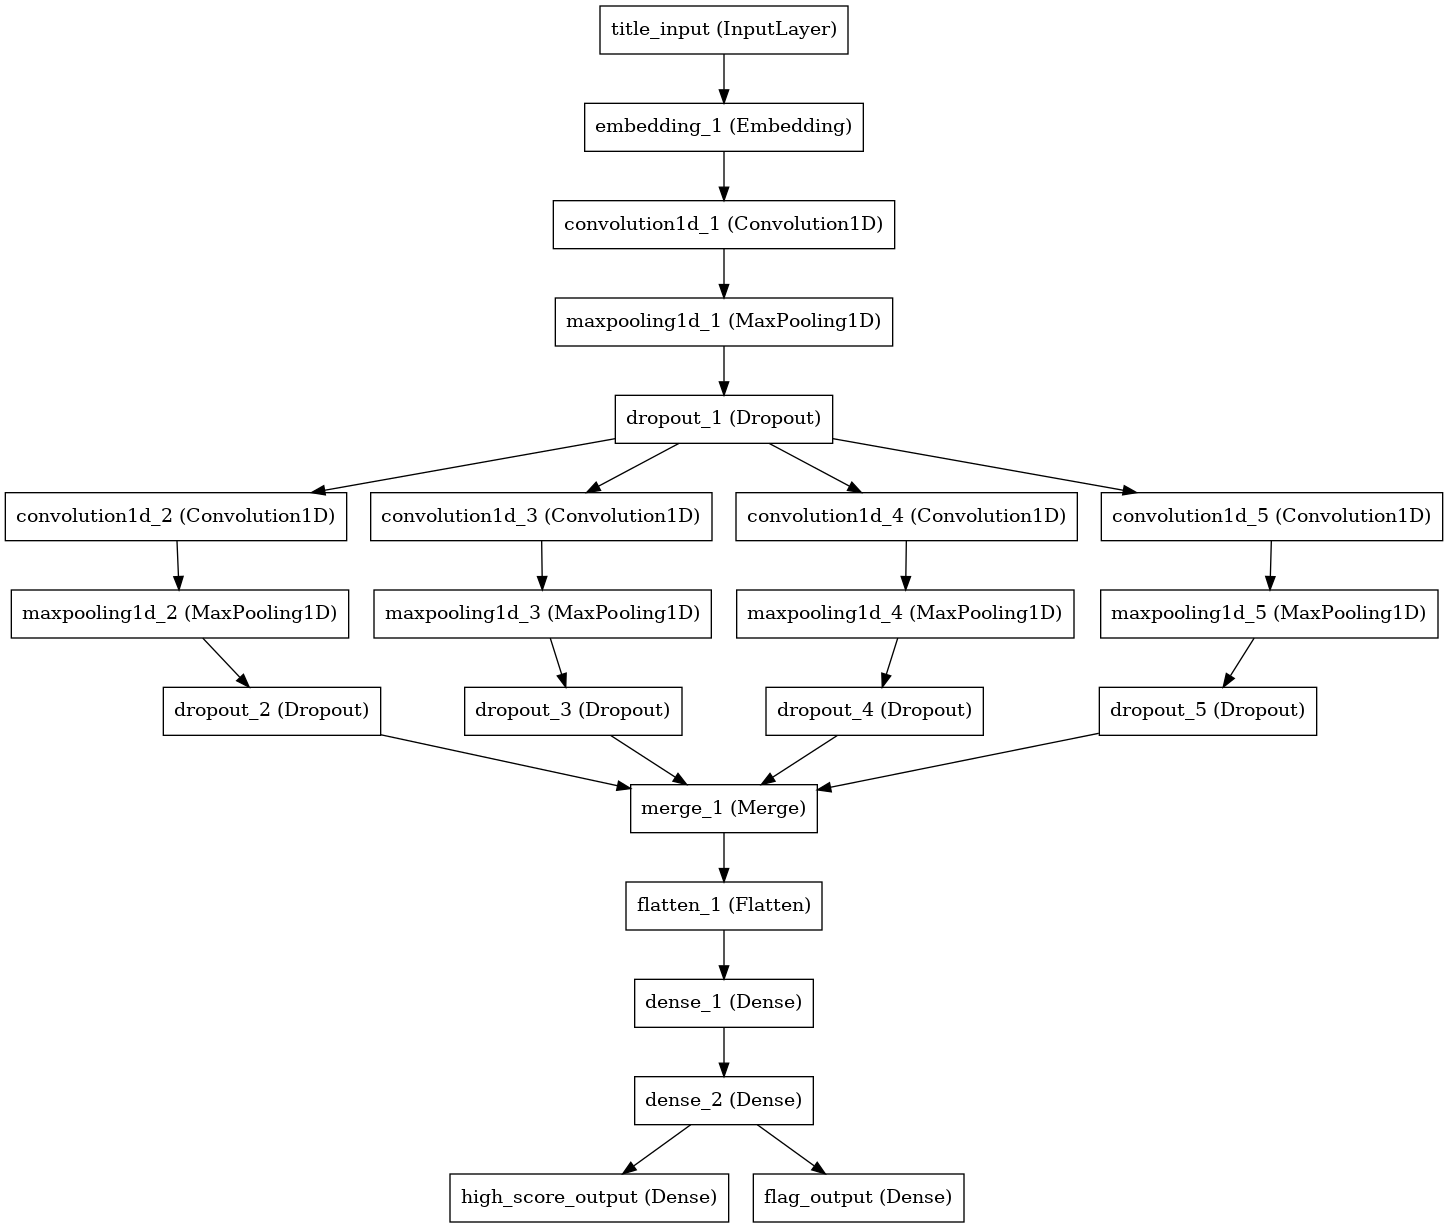
The title_input takes in a sequence of 80 values representing the title.
A value of 0 is used for padding, a value of 1 for overflow characters, and 2-101 represent the 100 most commonly used characters (which are eoatinrslcduhpgmyfSwbkTvACPMIDBWHFRENLGO:-0,.1x'U2YV?JzK)(j’–534q69Q+78"/$Xا[]“”Z&|لرمي%‘و#بتنةد;سه in case you care).
Each character is embedded in a 102 dimensional space where the embedding is initialized as a one-hot encoding but allowed to float during training.
Following the embedding layer, there is one convolutional layer with 128 filters and a kernel size of 3 characters followed by max pooling with a window of 2. The output of that is fed into four parallel convolutional layers, all with 32 filters, and with kernel sizes of 3, 5, 7, and 9. Each of these is then separately pooled with a window of 2 before being merged and flattened. The basic idea here is to allow the different parallel convolutional layers the opportunity to pick up on features of differing lengths.
Finally, this flattened output is fed through 3 densely connected layers with 64, 32, and then 2 nodes.
All activations are RELU with the exception of the last two nodes which have sigmoid activations to limit them to the range of [0, 1].
These outputs, high_score_output and flag_output, correspond to the probability that a story will have a score greater than or equal to ten and the probability that a story will get flagged dead, respectively.
These guys are what feed into the guages in the tool at the top of the page.
The loss function was binary cross-entropy with a weighting of 90%/10% between the success probability and the flag probability. I generally cared more about predicting success and it was also the more difficult of the two tasks.
Basic Performance
If there’s anything more fun than a graph, it’s two graphs side by side.
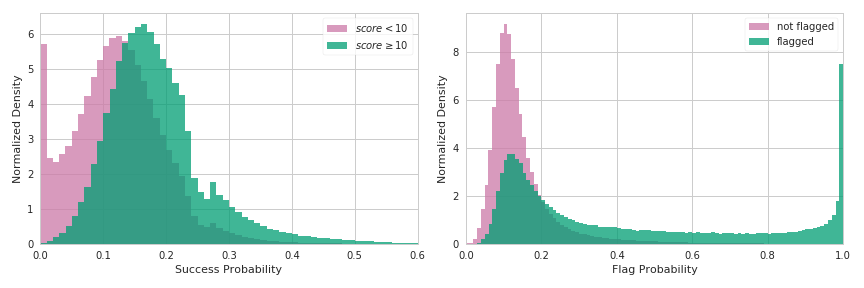
You can see immediately that there are many titles which are correctly predicted to not have any real chance of making it to the front page. These mostly correspond to non-English titles, all caps, blatant spam, and things like that. Beyond that, there’s a noticeable shift in the distributions with respect to the success probability, but no clear separation.
In some ways, the width of the success probabilities are actually more telling than the separation between the peaks. The bulk of typical stories, or those with non-zero success probabilities, have a distribution easily covering a factor of 2-3x in predicted success probabilities. (Very) loosely speaking, this can be interpreted as titles having at least this large of an effect on a typical story’s chances for success.
The flag probability does have a much more clear separation at the high end which means that you could filter out a significant fraction of stories with very few false positives. There are, however, a significant fraction of stories that the network can’t meaningfully distinguish which means that you would have a sizable false negative rate.
In terms of loss functions, the success probability has a binary cross-entropy of 0.3197 and the flag probability has one of 0.4386. To put it another way: a single bit of information could allow you to determine the success of 2.17 stories or the flag outcome of 1.58. Overall, that’s actually better than I was expecting. Let me tell you though… you should have seen the binary cross-entropy on that original LSTM network!
Extreme Examples
I would be remiss if I didn’t include the best and worst titles in the dataset, but I have to admit they’re a little bit underwhelming. Let’s start out with the “most likely to succeed.”
| Story | Success Probability | Score |
|---|---|---|
| CarWoo (YC S09) Launches CarWoo Version 2 To Keep Car Buyers Even More Informed | 1.0000 | 29 |
| Glassmap (YC S11) Launches v2.0: Social News Feed Meets Real-Time Map | 1.0000 | 30 |
| Hipmob (YC W12) Wants To Become The Premier In-App Customer Service Tool | 1.0000 | 21 |
| Talkray (YC W12), an under-the-radar messaging app, takes off overseas | 1.0000 | 17 |
| WePay (YC S09) Launches WePay Clear, a Stripe Competitor with Fraud Protection | 1.0000 | 92 |
Notice anything? If you want a guaranteed ticket to the Hacker News front page, all you need to do is to get into Y Combinator first.
Patterns similarly abound in the stories that are most likely to fail.
| Story | Success Probability | Score |
|---|---|---|
| جديد فستان كيت زوجة الامير وليام 2011 , صور فستان كيت زوجة الامير وليام 2011 | 0.0000 | 1 |
| صور+دينيه+2017+صور+ادعية+اسلامية+صور+دينية+جميلة+مصورة | 0.0000 | 1 |
| مشاهدة مباراة ريال مدريد وبروسيا دورتموند بث مباشر كورة لايف يوتيوب | 0.0000 | 1 |
| صور ثورة 25 يناير , صور ثورة مصر , تجميعه صور ايام صورة 25 يناير | 0.0000 | 1 |
| اهداف مباراة ريال مدريد راسينغ سانتاندير اليوم في الدوري الاسباني 2012 | 0.0000 | 1 |
I have to wonder whether these are submitted by bots or if there are people out there really playing the odds.
But what happens if an unstoppable force encounters an immovable object? The predictor tool gives “DropBox (YC S07) رمي بعيدا محرك أقراص أوسب الخاص بك” a whopping success score of 0.0. So yeah, definitely don’t submit your title in Arabic, even if you are a YC company.
It’s surprisingly fun to plug in hypothetical titles and see what the scores are. That said, I think it would be in poor taste for me to include my table of “______ has died” success predictions so I better wrap things up. I’m curious to see what other creative titles people come up with though!
Conclusion
This is mostly just for fun, but maybe some people will find some practical use in it as well. I have to admit that I’ll probably be pretty tempted to check my titles in this, even being fully aware of the caveats.
And of course, if you’re interested in sourcing data from around the web to make informed marketing decisions then please do get in touch with us. We help companies get access to the data they need and use it in effective and creative ways.
Suggested Articles
If you enjoyed this article, then you might also enjoy these related ones.

The Red Tide and the Blue Wave: Gerrymandering as a Risk vs. Reward Strategy
An interactive explanation of how gerrymandering is a risky strategy that allows for the possibility of a blue wave.
Designing The Wayback Machine Loading Animation
A walkthrough of how we helped The Internet Archive design a new loading animation for the Wayback Machine.
Check If A Website or URL Has Been Submitted to StumbleUpon
A simple tool to check the status of a URL in StumbleUpon's index, along with a description of how it works.
Comments