By Evan Sangaline | September 22, 2017
ADP vs Season Projections
In the first part of this series, Fantasy Football for Hackers I, I walked through the process of coming up with my own draft strategy using scraped projections and simulated rosters. A lot of people pointed out that I probably would have done better if I had just looked up the average draft positions and picked the best available players. As one user on /r/fantasyfootball so eloquently put it:

The thing is, I can’t really disagree with this. It became painfully obvious during our draft that my strategy wasn’t very applicable in the later rounds. Most of the available players at that point seemed only marginally better than those that would eventually be available on the waiver wire, and I had already had a reasonably solid starting lineup and backups. I had this feeling that I would never end up starting any of these players, that they wouldn’t have much trade value, and that I didn’t really know how to differentiate between them.
My current understanding is that a good strategy for these later rounds would have been to seek out “lottery ticket” players. These are basically players that will most likely spend most of their time on the bench, but could easily end up being promoted and becoming valuable assets if somebody ahead of them gets injured. The only problem is that these are much harder to identify than high scoring players. Projections are everywhere and easy to scrape, predictions about injuries and shifting lineups are much harder to come by.
I have a feeling that the answer is that you need to familiarize yourself with the lineups of each team and have some sense of how things would shift in the event of injuries. Maybe that’s something to aspire to, but it feels a little bit out of reach for me in the short term. A much easier approach is to look at the Average Draft Positions (ADP) and see how they differ from what the season projections would suggest. The ADPs presumably take into account the projections as well as any additional information, so the players who are more valuable than you would expect from projections alone are likely lottery ticket candidates.
First, let’s take a look at the ADP vs the raw season projections. I’ve inverted the y-axis here so that the better players are in the upper right corner of the plot.
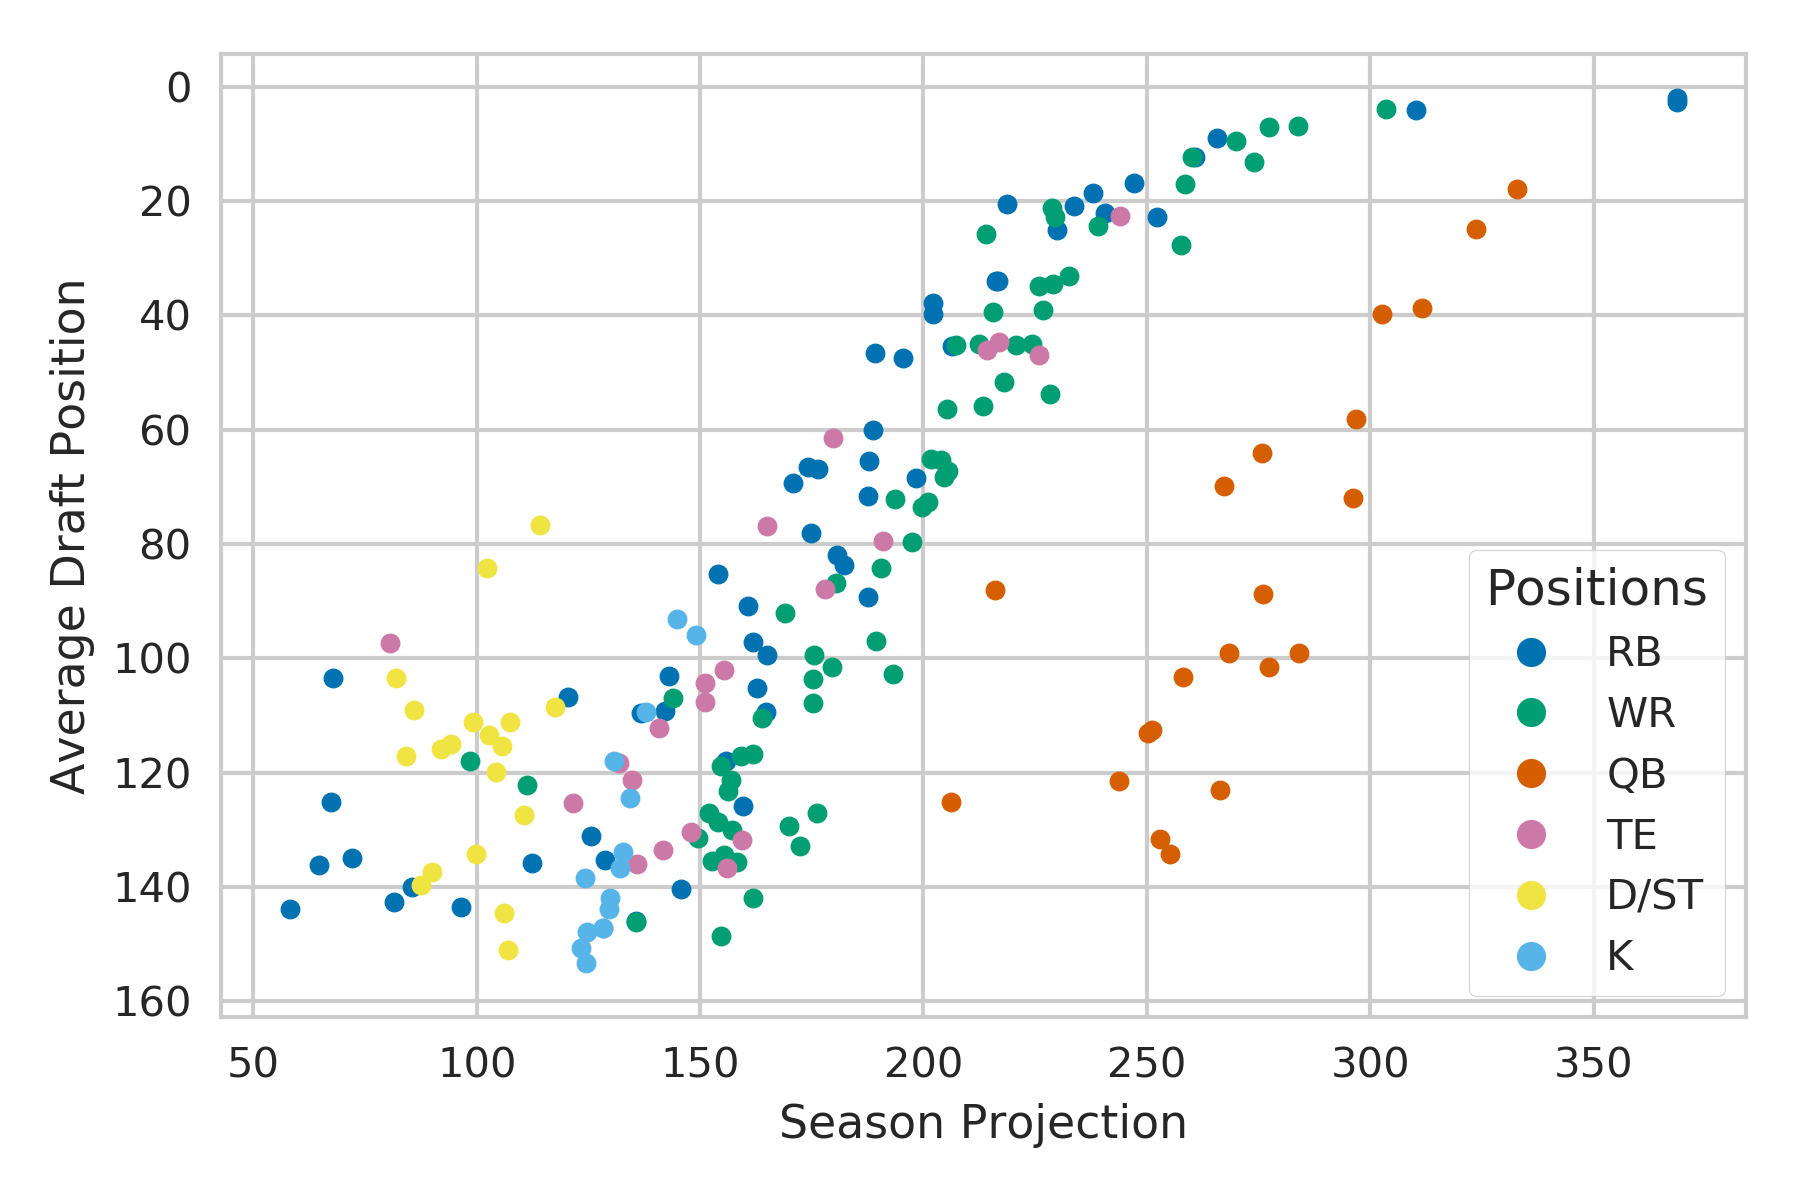
We can see immediately that the quarter backs draft much later than their projections alone would suggest. This is because each team can only start one quarter back and relatively OK quarter backs will be available on the waiver wire. We figured out more sophisticated baseline values for the players in Fantasy Football for Hackers I, but for now let’s just subtract the average season projections for each position.
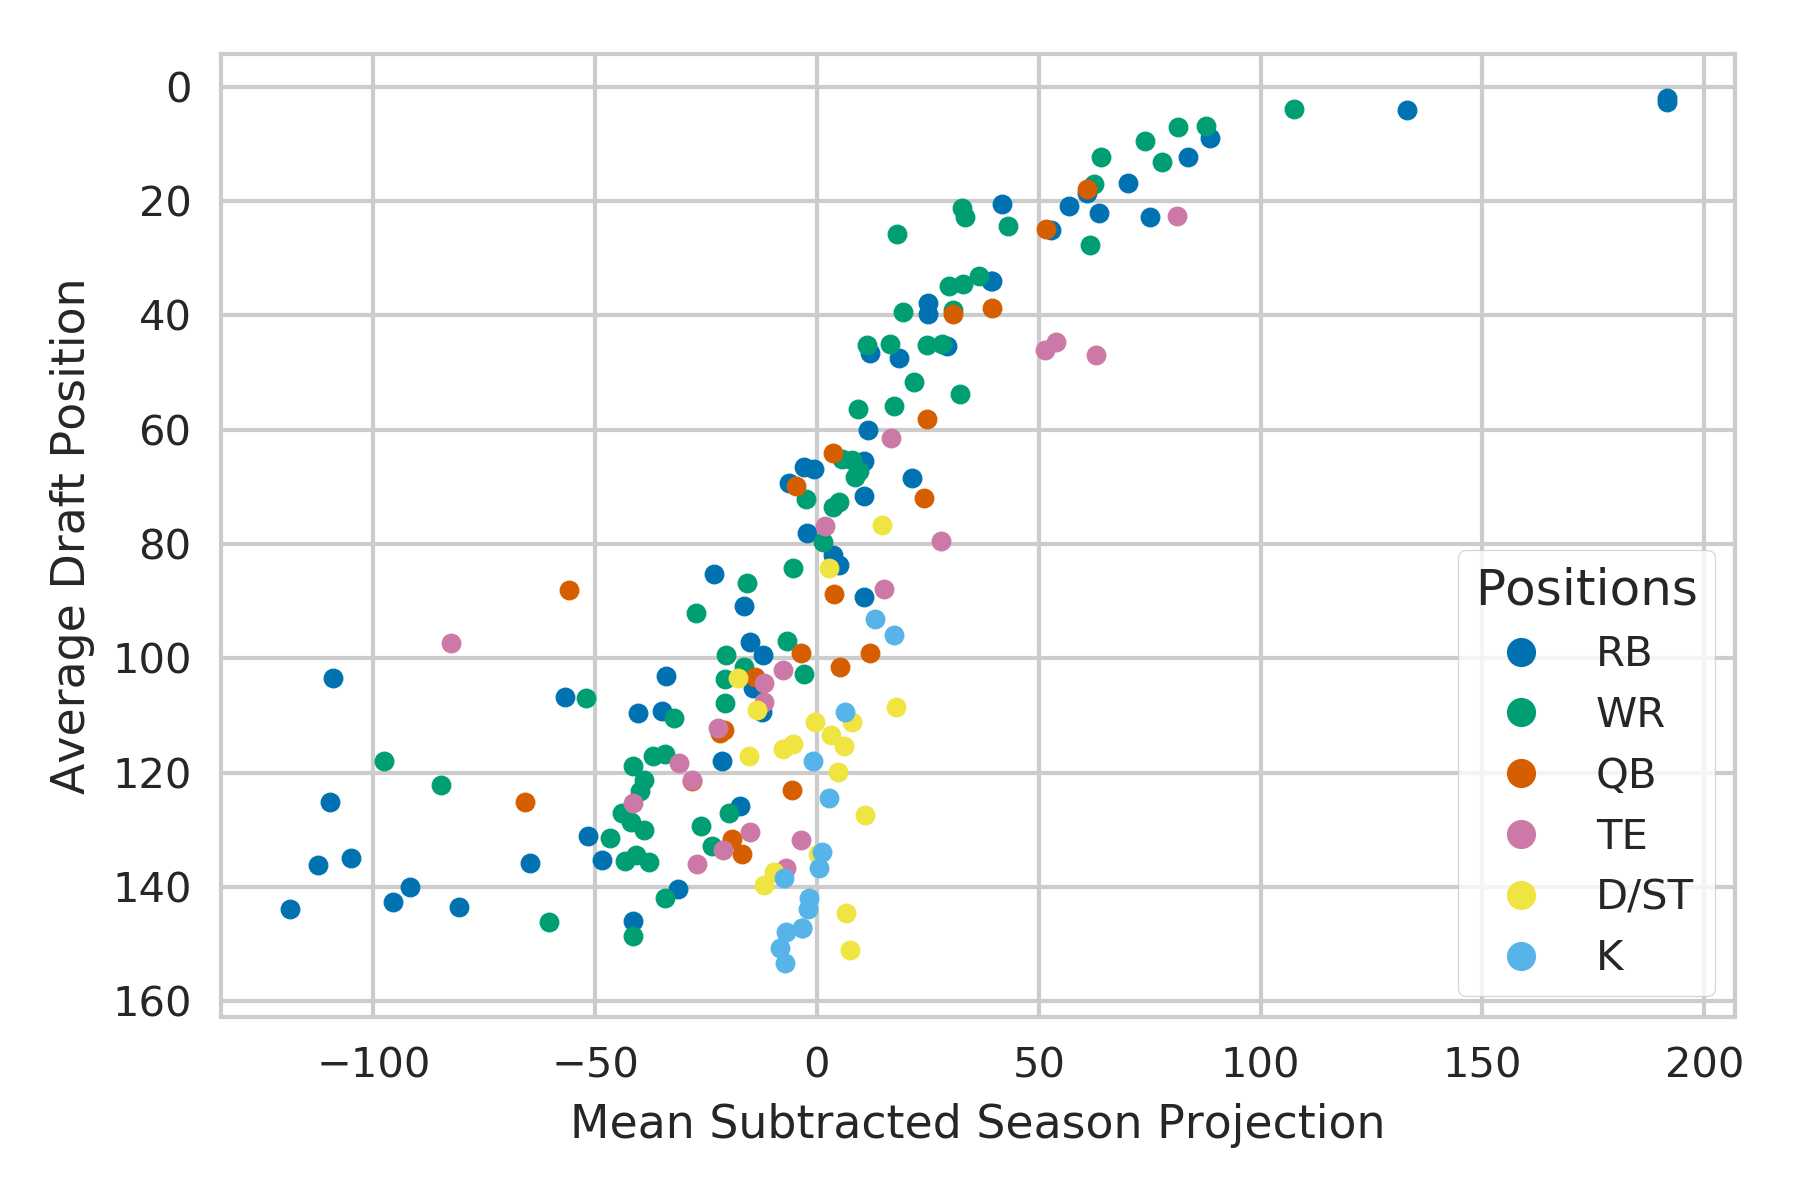
After doing this simple baseline subtraction, we can see that the players mostly fall on a relatively tight band where the higher draft picks go to the players with higher projections. In the lower left hand of the plot though, you see a number of players who get picked much earlier than their baseline subtracted projections would suggest. It seems likely that these are “lottery ticket” players, or have some other attributes that make them more valuable.
Most of these players that are more valuable than their projections suggest have ADPs in the range of 100-149, which corresponds to the 10th-14th rounds in these ESPN leagues. Some of the biggest outliers are Tarik Cohen, Nelson Agholor, Thomas Rawls, Jacquizz Rodgers, Darren McFadden, and Jeremy Hill. Would you describe these as “lottery ticket” players? I’ll have to do some research, but I’m guessing that they are.
Suggested Articles
If you enjoyed this article, then you might also enjoy these related ones.

The Red Tide and the Blue Wave: Gerrymandering as a Risk vs. Reward Strategy
An interactive explanation of how gerrymandering is a risky strategy that allows for the possibility of a blue wave.

Performing Efficient Broad Crawls with the AOPIC Algorithm
Learn how to estimate page importance and allocate bandwidth during a broad crawl.

A Brief Tour of Grouping and Aggregating in Pandas
Learn how to use pandas to easily slice up a dataset and quickly extract useful statistics.
Comments